What's going on with retained earnings?
At the end of the last section, I left you with a question. You are only allowed to read on if you have a hypothesis.
Download the model from the end of the last lesson:
To obtain the worked example file to accompany this chapter buy the financial modelling handbook.
The question was this:
All the available cash being paid out, leaving a cash balance of zero in each period? However, not all the earnings are being paid out, leaving some retained earnings in the business in each period? Why is that?
Have you reviewed the model? Do you have a hypothesis?
Let's go period by period and compare what's happening on the income statement and the cash flow statement to understand why this is. It may be easier if you have the model open as we go through this.
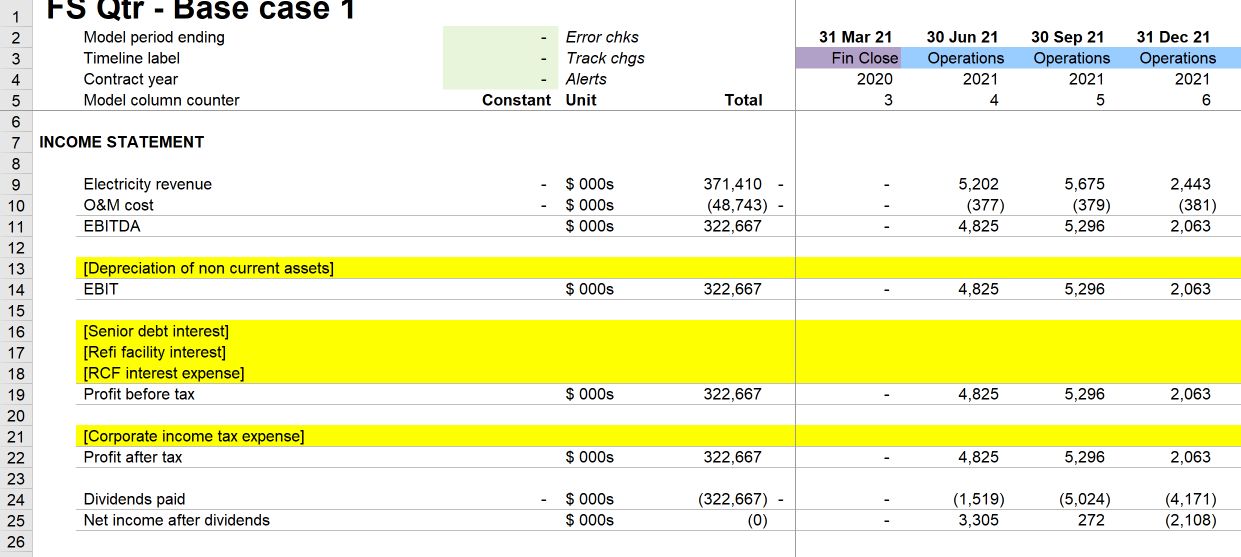
Let's look at the first operational period to 30 Jun 2021. This is column M in the model.

Profit after tax in that period is $4.825m.
We make a $1.519m distribution leaving $3.305m of earnings in the business.
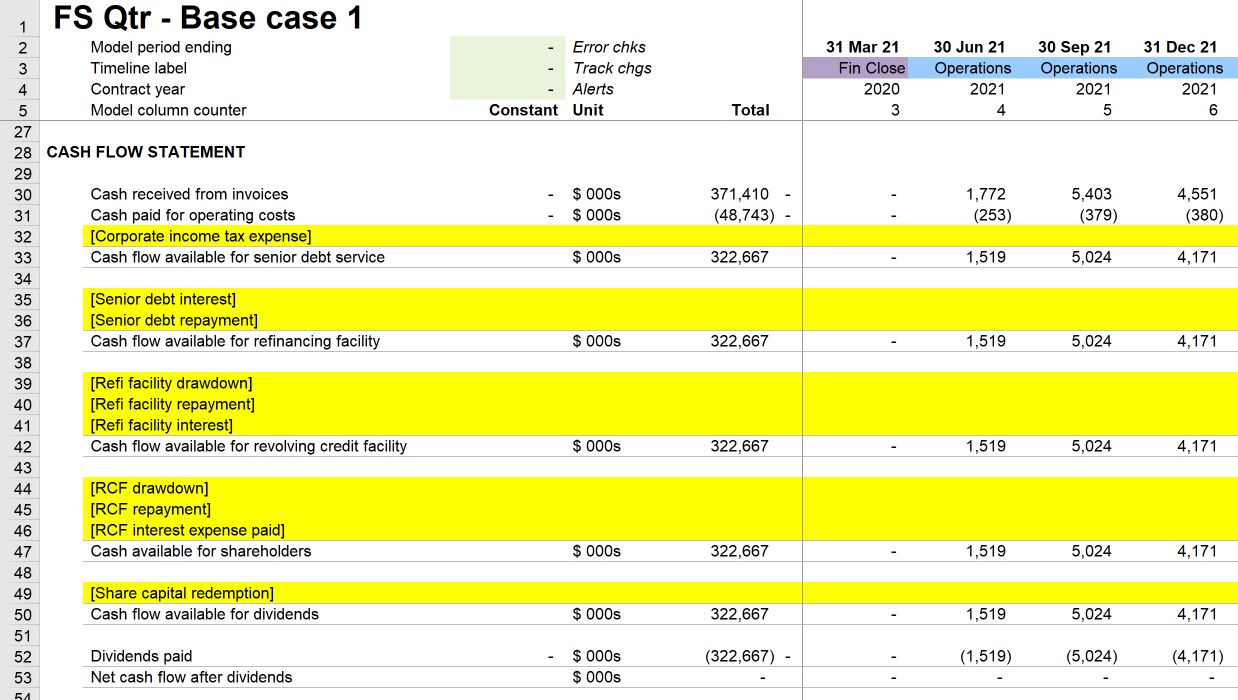
Let's look at the cash flow in the same period:

Cash flow available for dividends is $1.519m, all paid out in dividends.
Why is there a difference between Profit after tax and Cash flow available for dividends?
The difference is due to working capital.
In the same period, we recognise $5.202m of revenue on the income statement. We are only receiving $1.772m of that in cash. The difference between those two amounts is $3.430m.
This means we have $3.430 more profit than cash due to working capital.
Similarly, we are expensing $377k of O&M cost in the period but only paying $253k in cash. The difference between those two amounts is $124k
This means we have $124k more cash than profit due to working capital.
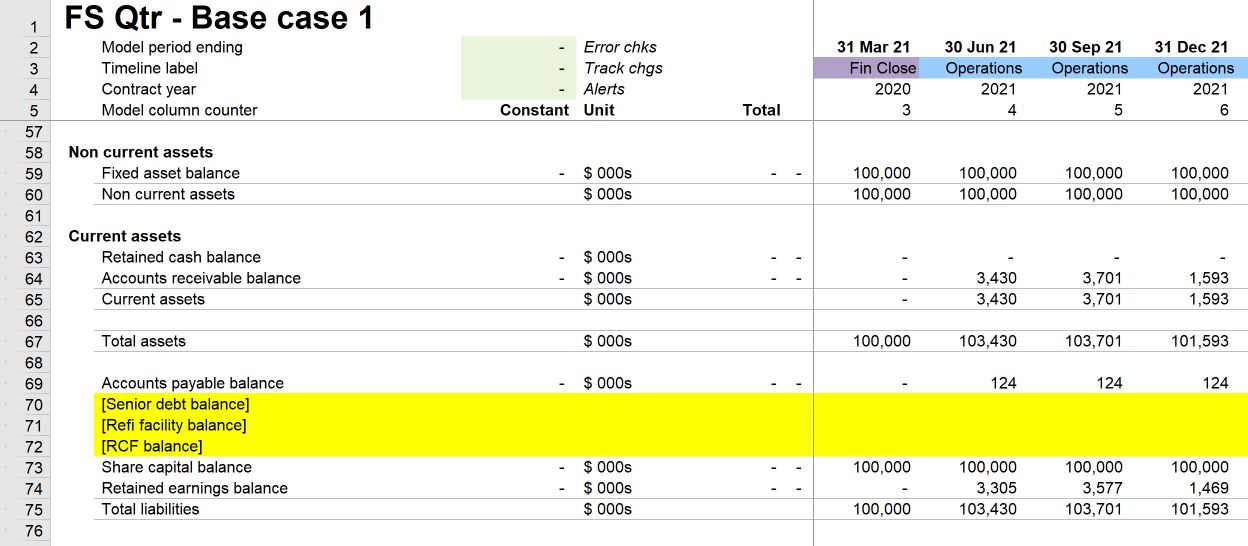
We can see those amounts on the balance sheet:

The $3.430m difference between revenue and cash received is the same amount as our Accounts Receivable balance.
The $124k difference between O&M cost expensed (i.e. recognised on our income statement) and paid (i.e. recognised on our cash flow statement) is the same as our Accounts Payable balance.
The difference between Accounts Receivable and Accounts Payable is our "Net working capital" balance.
In this period, the Net working capital balance is :
- Accounts Receivable: $3.430 minus
- Accounts Payable: $124k giving
- Net working capital of $3.305m.
This $3.305m is the net difference between Profit and cash received.
Note that this amount matches the amount of retained earnings remaining in the business in that period.
Compare this with the period to Dec 2021 (column O in the model).
- Due to seasonality, our revenue drops to $2.443m
- Our cash received from invoices is higher at $4.551m.
Due to timing lag, we are receiving some of the previous period's revenue in this period.
- Profit after tax in this period is $2.063m.
- Cash flow available for dividends is higher, at $4.191m.
So how much dividend will the business pay?
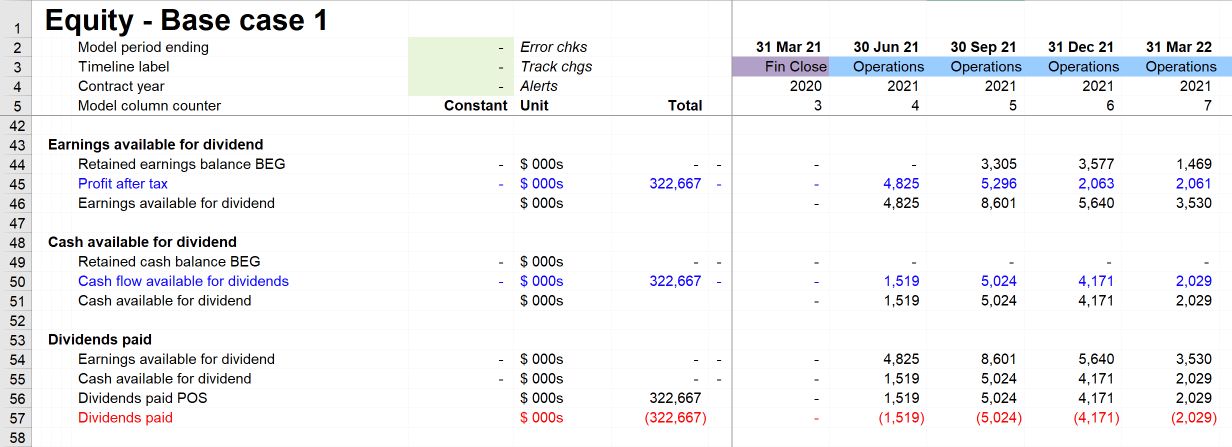
It will always be the lower of cash available and earnings available.

Total earnings available in the period are:
- $3.577m retained earnings from previous periods, plus
- $2.062m Profit after tax in this period, giving
- $5.640m earnings available for dividend.
Total cash available in the period is:
- $0 retained cash from previous periods
- $4.171m of cash available in this period, giving
- $4.171m of cash available for dividend.
The amount of dividend paid is, therefore, $4.171m. This dividend payment causes the retained earnings balance to reduce from $3.577 in the previous period to $1.469m in the current period.
What is the net working capital position in the same period?
- Accounts receivable balance is: $1.593m
- Accounts payable balance is: $124k
- Net working capital: $1.593 - $124k = $1.469m
Therefore, we can see that, in the current model, in any period, the retained earnings balance is equal to the amount of net working capital. The net working capital balance shows the difference between Profit and tax. This difference is "balanced" by the retained earnings balance.
The picture won't always be as clear as this. As we add more line items into the model, the position will become more complex. But it's helpful to look at it now when there are only a small number of items on the financial statements and clearly see the dynamics at work.
Why is this important?
This kind of analysis will help you develop an intuitive understanding of how our three financial statements interact and affect each other. I learned accounting before I learned financial modelling. It was only when I learned financial modelling and saw how the three financial statements interact dynamically that I fully understood their relationship with each other.
Shortly we’ll look at depreciation, a non-cash item. We'll continue the kind of analysis we've done in this section by asking what happens when a cost only goes through the income statement.

Comments
Sign in or become a Financial Modelling Handbook member to join the conversation.
Just enter your email below to get a log in link.